

In our last tech blog post, we discussed why Google Analytics is important and offered our free Step-by-Step Guide for setting it up for your own business.
DOWNLOAD OUR FREE STEP BY STEP GUIDE HERE TO SET UP YOUR GOOGLE ANALYTICS
This week, we want to discuss how to navigate and understand the reports that come from your Google Analytics. Below we have broken down everything you need to know into 6 easy steps.
Reports Sidebar Breakdown
First, you’ll want to sign in to your Google Analytics account and check out your left-hand sidebar (this is your go-to navigation when using Google Analytics) and find the Reports sidebar that is broken up into 5 sections.
In order to provide context to your data be sure to place time constraints on it. In the top right-hand corner of your dashboard click the date drop-down menu and select a range of time to display data from.
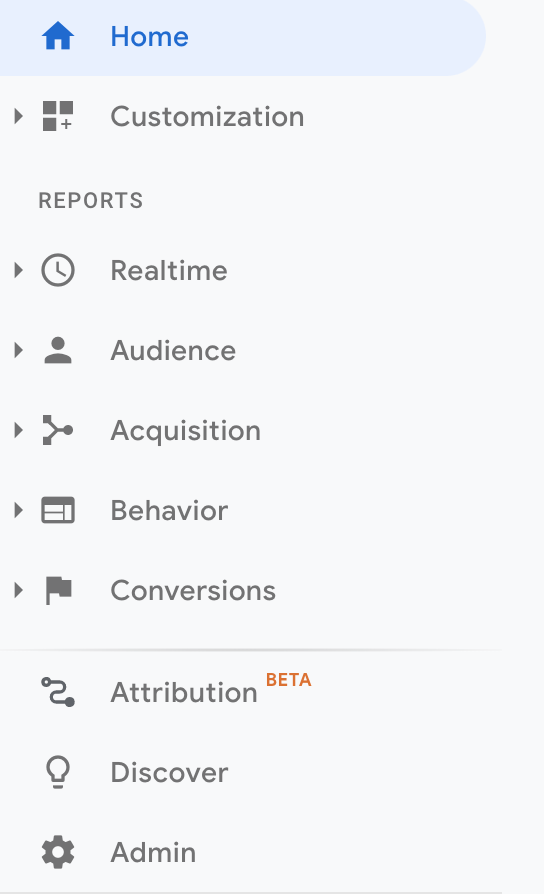
- Realtime
As the name implies this section allows you to gather insight into what’s happening on your website at that very moment in time.
- Audience
Helps you learn a bit more about your users’ characteristics. These characteristics include demographics (age, gender), interests, locations, behaviors, and device use.
- Acquisition
These are pivotal when analyzing your website traffic. Use this section to discover where your traffic is originating from and determine which marketing avenues are most effective at driving high-value inbound traffic.
- Behavior
This section reveals what pages people are visiting, the actions they’re taking, and their journey throughout your website.
- Conversions
This report needs to be set-up, but generally provides metrics to evaluate the value of your online business via revenue from eCommerce or other variables/events set-up in Google Analytics like email sign-ups or contact inquiries.
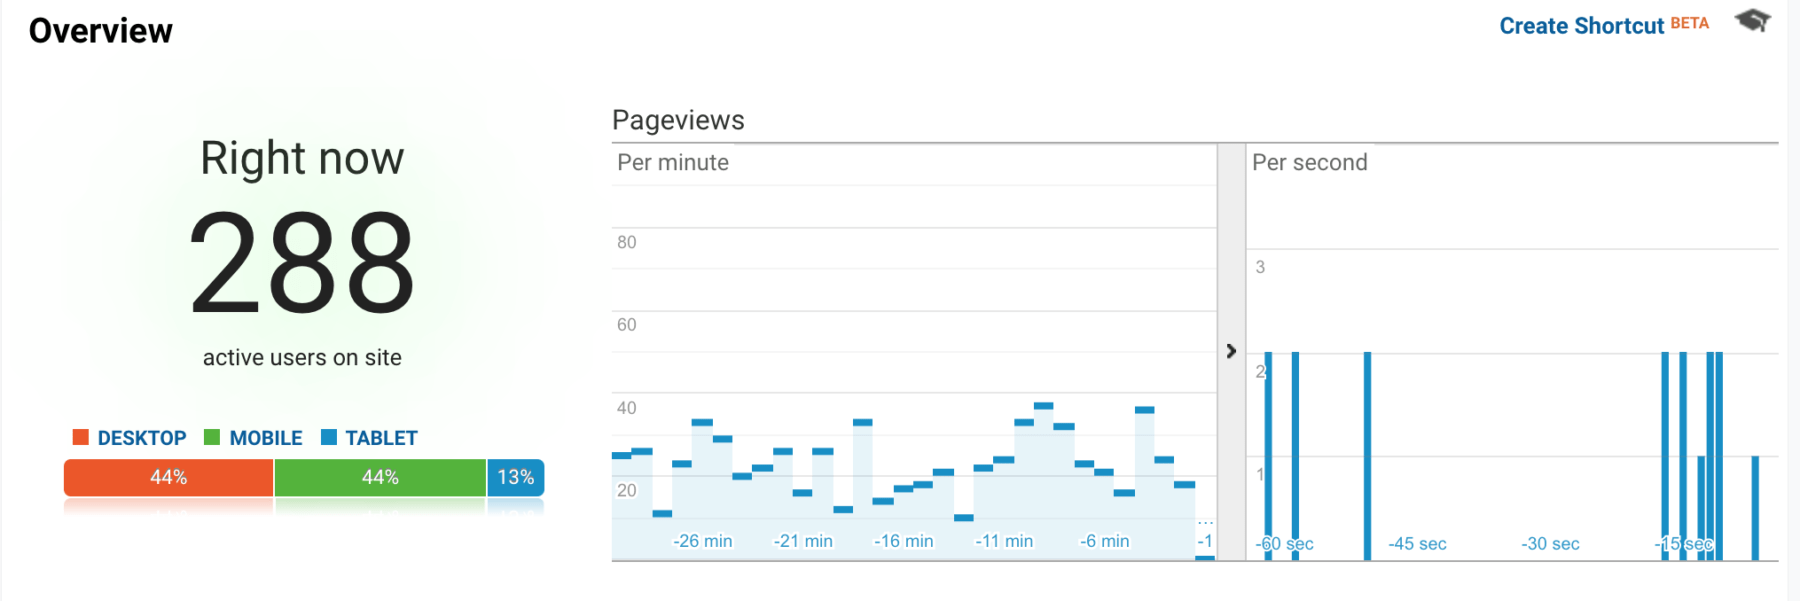
1. Getting Comfortable with the Realtime Report
We find that this report generally offers the least value on a day to day basis. However, it’s a great resource for things like:
- A quick glance at how your new blog post is performing
- Monitoring the progress of your one-day sale/event
- Double-checking to ensure a new URL or tracking code is working correctly
As you click the drop-down menu, Google Analytics provides a host of more detailed information including:
- Location of visitors
- Source of traffic (i.e. organic, direct, social, newsletter, etc.)
- Content visitors are consuming
- Any events they might have completed
- Conversions
All of this information is useful, but can be found in greater detail in the other Google Analytic Reports.
2. Insights into your Audience
At Darby Comm, one of the first places we start with a new client is taking time to review and analyze their Audience Report over the last year. This gives us a more well-rounded understanding of who’s visiting their website.
The Audience Report provides a high-level overview of your inbound web traffic. If you’re auditing your current marketing strategy or crafting a new one, spend some quality time with the Audience Report to understand the makeup of your digital audience. However, it can get complicated quickly.
Start simple. We suggest beginning your analysis using the following questions:
- What are the key demographics of my customers?
- To answer this you’ll explore the demographics drop-down menu and click into the “Overview” section.
- Once you’re ready to dive into more detail, explore the “Age” and “Gender” sections to get a better idea of the age and gender distribution of your web traffic over time.
The number of users in each age bracket is important but it won’t provide the full picture. Be sure to review the Behavior and the Conversion metrics of each bracket. You might discover that a particular age bracket spends longer on your website and has a high Conversion Rate when compared to other brackets.
- Where is my web traffic located, and how are they experiencing my website?
- Get to know the location of your customers by clicking the “Geo” drop-down menu and choosing “Location”. If you typically have a more regional focus, click on “United States” to load traffic numbers by region. To further refine your region navigate up to the small “Primary Dimension” menu bar and click “City”.
- It’s also important to understand how users are experiencing your website. Be sure to review the “Mobile” section and click “Overview”. This will provide a glimpse into the devices used when surfing on your website.
If you know the majority of your traffic is coming from mobile devices, be sure to optimize your website with a mobile experience in mind. Keep a close eye on bounce rate and Avg. Session Duration. If there’s a huge discrepancy between Mobile and Desktop you’ll want to take note.
3. Get the most out of your marketing with the Acquisition Reports
As a PR & Digital Marketing Agency, this is where our team spends the most time when planning our PR and Marketing strategies. The Acquisition Reports are chock-full of useful information and will help you identify where your marketing efforts are excelling or where they might need a boost.
We suggest starting by jumping straight into “All Traffic” and checking out “Channels”. This section breaks down your website traffic by channel and provides a valuable starting point in determining how users arrive.
- Organic: Using a search engine (SEO)
- Direct: By typing in the URL (Brand Awareness)
- Referral: Clicking a link on another website (PR)
- Social: Through social media (Owned Social Channels)
- Paid: Paid advertising promotion (PPC, Social Ads, etc.)
- Email: An email link (Newsletter, Email Marketing)
- Other: Google Analytics doesn’t recognize the acquisition source
Once you’ve reviewed the Default Channel Groupings as a whole, take some time and dig into each channel to learn more. Consider these questions as you review them:
- Which landing pages have the highest acquisition rate from the Organic Channel?
- What websites are referring the most website visitors?
- Which social channels have the most engaged visitors?
- Which email campaigns sent the most traffic?
4. Tracking Behavior is Key to Success
Now that you know a bit more about your visitors, it’s time to dive into how they’re behaving on your site. You may be receiving an abundance of traffic, but if your traffic is not engaging with your site or converting there may be some bigger issues.
The Behavior Report provides an in-depth look into the journey your visitors are taking once they land on your site. Start with the Overview section to get a broad understanding of the pages people are visiting. Generally, your home page will have the largest percentage of Pageviews. But, pay close attention to your top 5 pages. Ask yourself a few simple questions:
- Is there a large dropoff in Pageviews of other pages after the home page?
- Is there an important page on my website that’s not receiving traffic?
Once you’ve familiarized yourself with the Overview section it’s time to go a bit deeper and track the ‘flow’ of visitors on your site. Click the “Behavior Flow” section and choose “Landing Page” in the drop-down. This will provide a visualization of the common paths visitors are taking upon arrival.
Spend some time hovering over each box to bring up information on visitor traffic for the given page. If you’re interested in highlighting a single path to see it in more detail click a landing page callout and choose “Highlight traffic through here”.
As you continue to absorb Behavior Flow information consider the following:
- What’s the most common path visitors are taking to convert?
- What pages have the highest drop-off rate?
- Are there fewer drop-offs when visitors land on my site on a page other than my homepage?
Play around with the menu dropdown. After exploring “Landing Page”, type in “Source” and perform the same analysis as you did before. Once you’ve done this, click on a Source callout and choose “View only this segment”. This will provide a clearer view of the Behavior Flow of traffic from a given source.
As you get more comfortable with Google Analytics, it’s worth diving into the additional dropdown menus in the Behavior Reports. Pay particularly close attention to the “Site Content” dropdown. This is packed with useful information about specific pages on your website. Take a moment to compare metrics in the “Landing Page” section with metrics in the “Exit Page” section. If your top 5 highest trafficked Landing Pages are similar or identical to the top 5 Exit Pages, you may want to consider trying to encourage people to take specific actions on each page. This will lead to greater site exploration and encourage visitors to spend more time exploring your site.
5. Conversions, Conversions, Conversions
Ultimately, conversions are what truly matter. For the Conversion Report to be valuable, you’ll need to spend some time setting up your goals in the “View” settings section and connecting your eCommerce tracking. If you’ve never done this, we suggest downloading our free Step by Step Guide to Setting up Google Analytics.
Once your goals and eCommerce tracking are set-up, the Conversion Report provides powerful and important insight into how successful your site is at converting visitors. As always, start with the big picture and work your way down. Click the “Goals” dropdown and explore the “Overview” section. This will provide a 30,000’ view of your goal completions. Pay particularly close attention to the Goal Conversion Rate over time. Under the Goal tab, click on “Source/Medium” to discover which sources are leading to the most conversions.
Next, if you have an eCommerce presence click the dropdown and start at the “Overview” section. Once you’ve familiarized yourself with this section, find the “Top Revenue Sources” tab and choose “Source/Medium”. This will provide you with an overview of the top revenue-driving sources. This information is pivotal when analyzing the bottom-line impact of your marketing efforts.
A Start to Understanding Google Analytics
While the information above is by no means exhaustive, it provides a solid starting point in understanding the importance of each report. There’s no getting around it, Google Analytics is complicated. However, the more you get comfortable with it the more informed you’ll be when making important marketing decisions.
If you’re ready to go deeper into your analytics or are interested in a customized visual Google Analytics Report, let’s talk! Our team would be happy to help!